Call Analysis
In this article, we will delve into the topic of analytical processing of call statistics to gather information about existing issues and find ways to address them. A well-formulated diagnosis resulting from such analysis allows for appropriate adjustments to be made to the system configuration to enhance its efficiency.
We won't be able to cover all aspects and nuances of statistical analysis, but we'll provide you with a guideline that can help you identify solutions to problems in your phone system. To illustrate this, we will examine a real example of statistics collected by one of our RingoLine PBX clients, in a system with a simple distribution of incoming calls to a group of four employees.
Statistical Data Collection
Let's break down the statistics and data visualization using a specific example. In our case, the incoming call distribution scheme follows this algorithm: first, the call enters a voice greeting that lasts about 10 seconds, then it's transferred to a group of 4 sales department managers. Any one of them should answer the call.
To analyze the statistical results obtained by our client, we will use the data from standard RingoLine system reports on incoming calls:
- Total number of calls
- Number of processed calls
- Number of missed calls
- Call processing percentage
- Average call duration
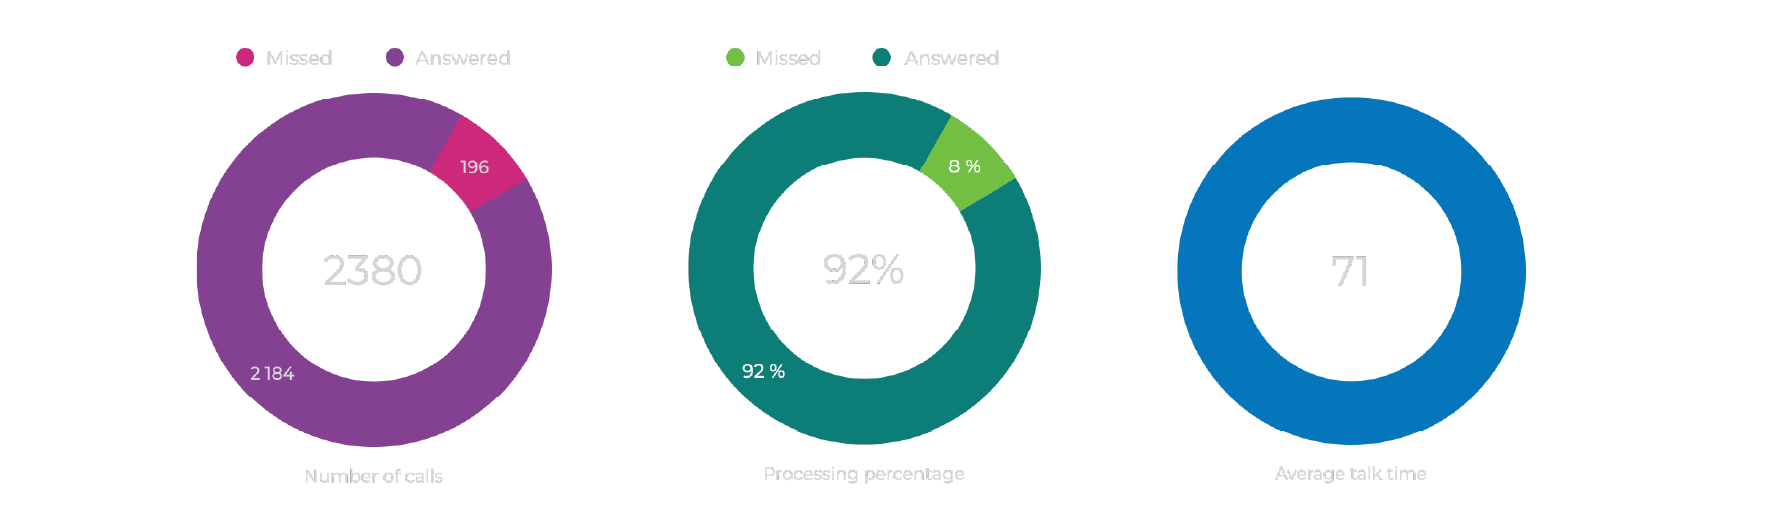
From the given example, it's evident that with additional settings, you could attempt to reduce the percentage of missed calls, which in our example is 9%. Here, you can quickly gauge whether this effort is worthwhile, as the number of missed calls isn't significantly high and might already be acceptable for your system.
Let's assume we decide to try reducing the number of missed calls. In that case, we need to delve into the analysis of more detailed reports, such as the report on missed calls, which displays statistics on waiting times for answers from your clients. The report shows the relationship between the number of clients still waiting for an answer and those who have hung up, over time from the beginning of the call. In other words, it indicates how many clients will still be waiting for an answer at a given moment and how many will have given up by then.
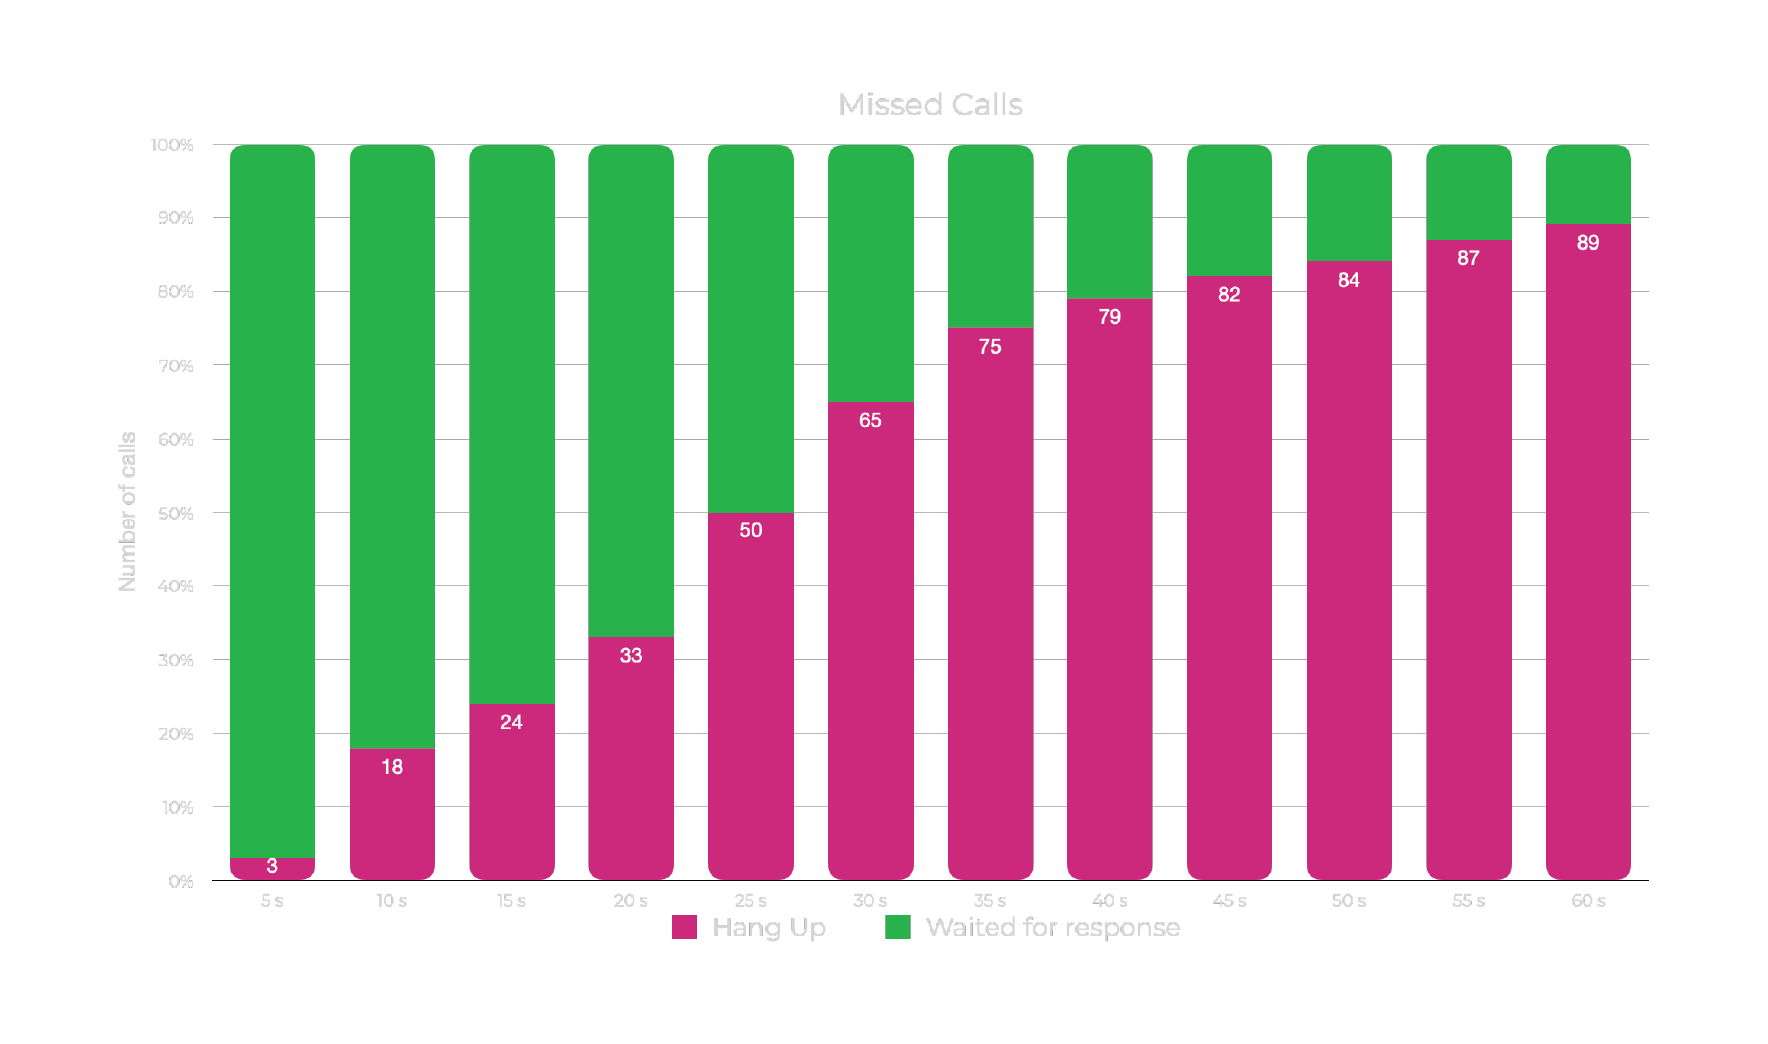
From the diagram, it's evident that, for instance, by the 30-second mark, approximately 38% of incoming calls will be abandoned, meaning clients will not wait and will hang up. Analyzing such a diagram will help you determine the rate at which you should answer calls to minimize customer loss. The provided diagram reflects a specific example; in your case, the diagram might appear differently.
In various systems, including our own, there are other report options available. A comprehensive analysis of data from these reports is intended to assist you in accurately determining the directions for configuring your system.
It's worth noting that the collected statistics can be used not only for analysis but also for predicting your system's behavior under specific circumstances. The volume of calls can vary based on time of day, day of the week, work schedule, the structure, and specifics of your business.
The table presents the results of such calculations:
| Number of operators (employees) | % of calls answered without waiting | % of calls answered within 20 seconds | Operator occupancy % | |
| 2 | 81% | 85% | 36% | |
| 3 | 96% | 97% | 24% |
These results assume that these employees will be solely occupied with call handling, they will be available to answer calls, and they will be ready to answer immediately.
These are ideal conditions, but they allow us to assess the resources needed and plan actual expenses or determine the direction for enhancing productivity.
Now, you can attempt to compare the forecast values with actual statistics.
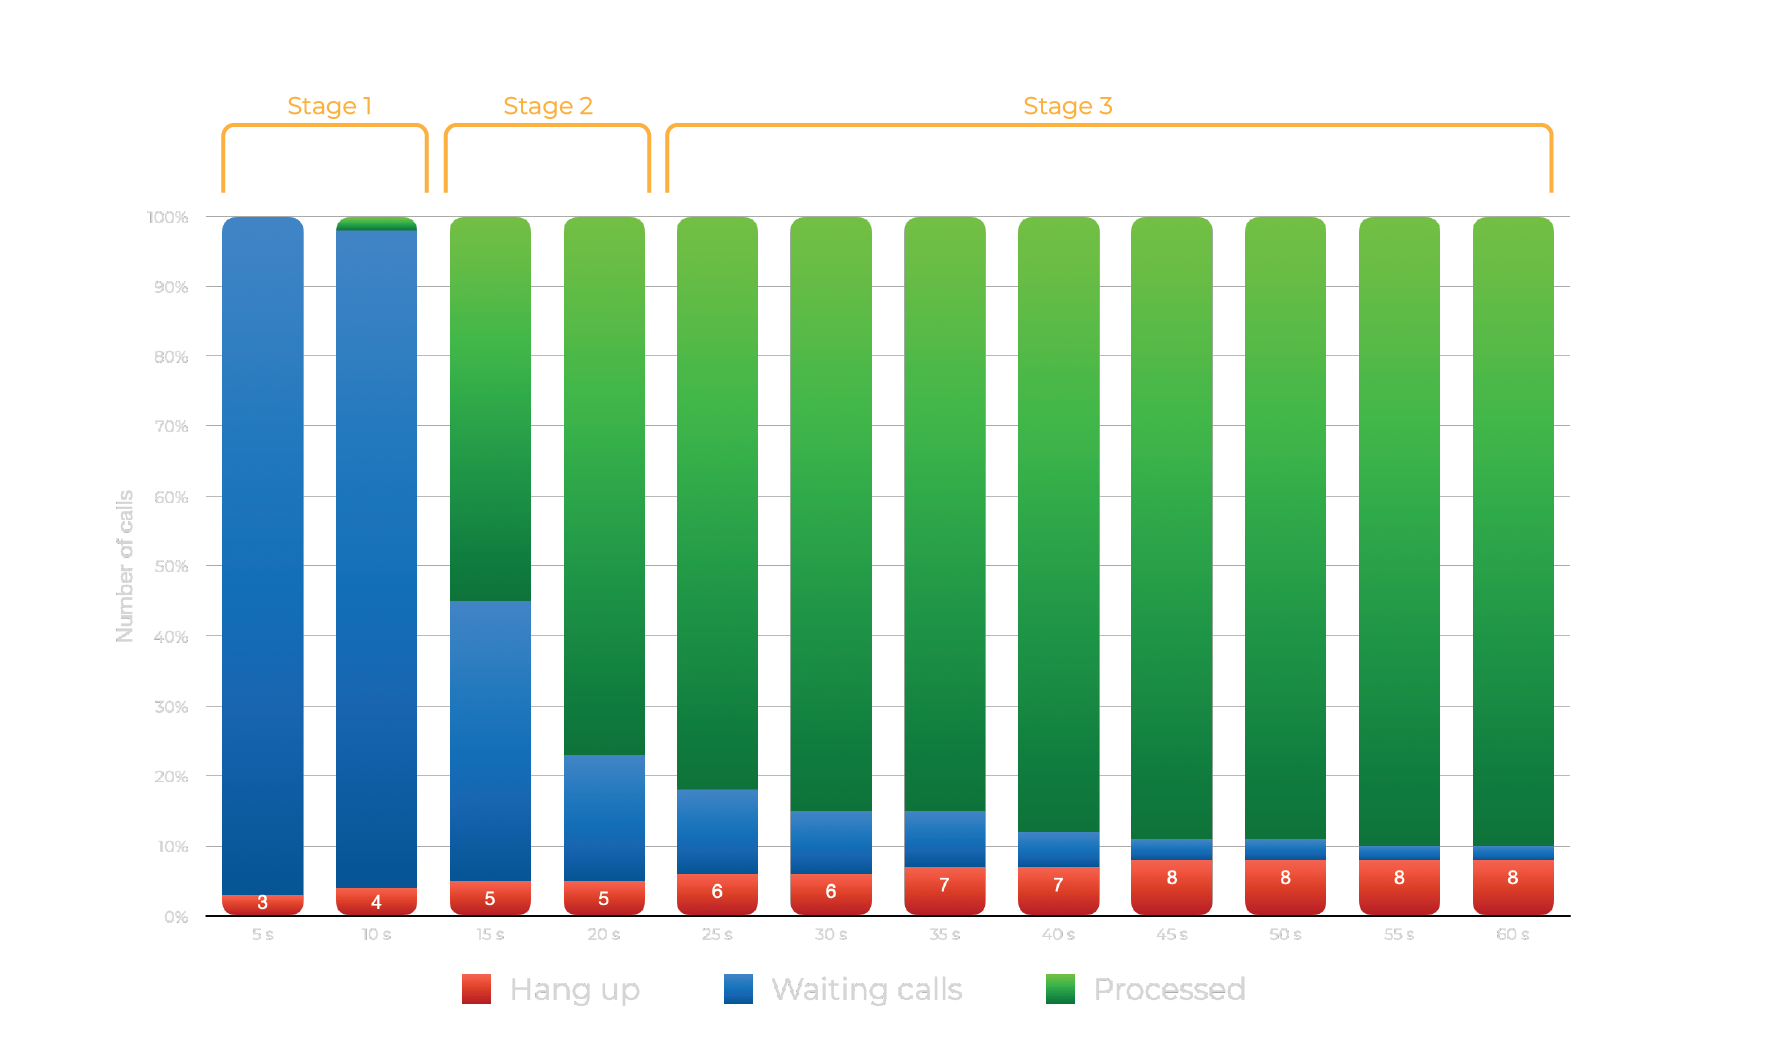
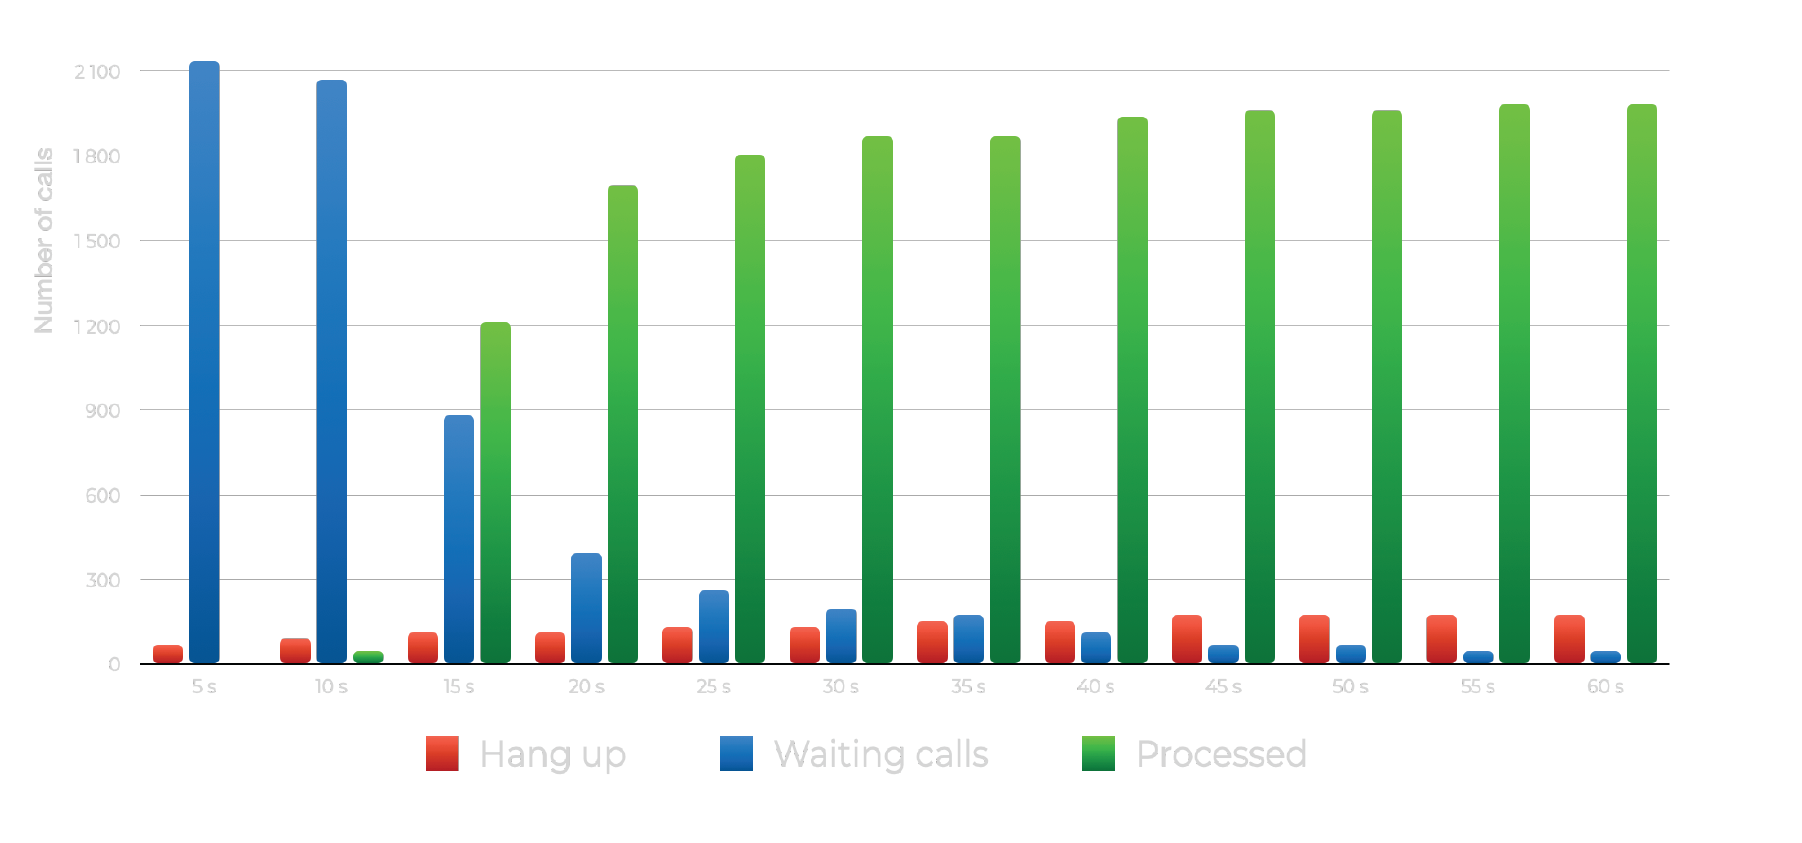
From the provided graph, it's clear how waiting calls (blue) transition into either answered calls or missed calls, illustrating the dynamics of such changes.
Roughly, three stages can be distinguished here (see graph). In Stage 1 (10 seconds), the client listens to the greeting and call recording information. In Stage 2 (another 10 seconds), calls are transferred to the employees' phones (4 phones). Approximately 84% of calls are processed within these 10 seconds. At this point, it's evident that the actual processing situation doesn't align with the calculated (forecast) one. Clients waiting for any of the employees to become available and answer the call characterize stage 3. Around 7% of waiting calls are processed during this stage.
Six months after implementing our solution, we analyzed the effectiveness of working with missed calls. It turned out that in 82% of cases it is possible to reach and retain the client.
The discrepancy from the forecasted numbers arises because the forecast was calculated under ideal conditions. In practice, employees (sales managers) might be engaged in work, on lunch break, or not answering calls due to other objective reasons.
What solutions are available to improve the situation? First, it's essential to ascertain whether unprocessed calls resulted from objective circumstances. If not, addressing the operational discipline of operators is necessary. Secondly, consider increasing the number of employees handling incoming calls if your financial situation allows it. If that's not possible, thirdly, there is an option to designate reserve operators from the rest of the company's staff who could handle calls in situations when all primary managers are occupied.
Employee Action Control
When configuring "group" forwarding, it's challenging to trace the cause of missed incoming calls and the degree of employee responsibility in this matter through generated reports. While you can view call information such as date, time, and duration in a report, the exact reason for a call going unanswered cannot be determined. Unlike call center operators, regular employees are not obligated to log their absence in the system. Moreover, they have numerous other tasks aside from answering calls, and it's justified for them to be engaged in other work and not be available for phone conversations.
In such cases, a mechanism for real-time operational control can be helpful. The fact of a missed incoming call can be monitored through email notifications. These emails can be sent to both supervisors and specifically designated controllers. In the RingoLine system, the email message includes information about the missed call, the employees to whom the call was redirected, and the call duration. This facilitates quick action to understand and rectify the situation.
If an operational control mechanism isn't set up or available in the system, you can try analyzing statistics from different perspectives and attempt to draw conclusions based on your own experience, knowledge of your business's peculiarities, and intuition.
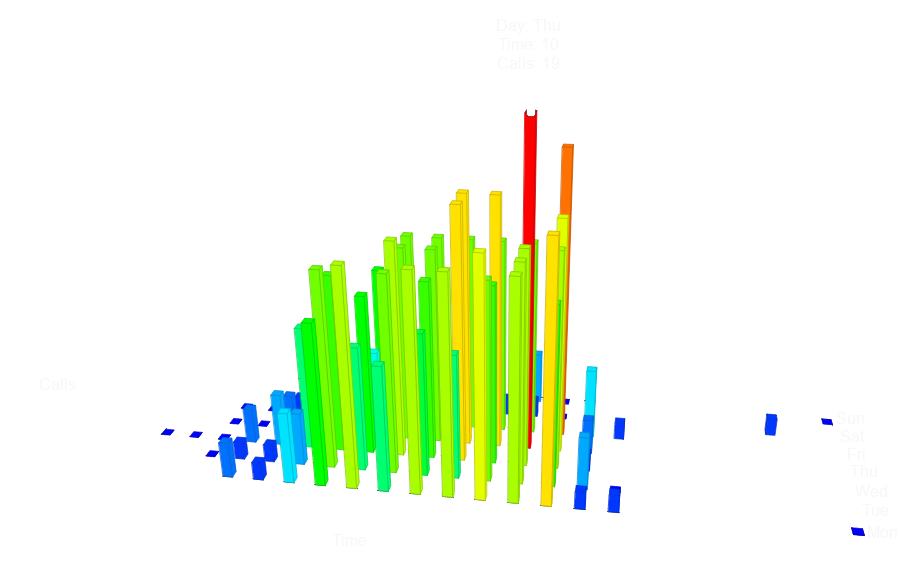
As an example, let's present a sample indicating the percentage of missed calls over a week.
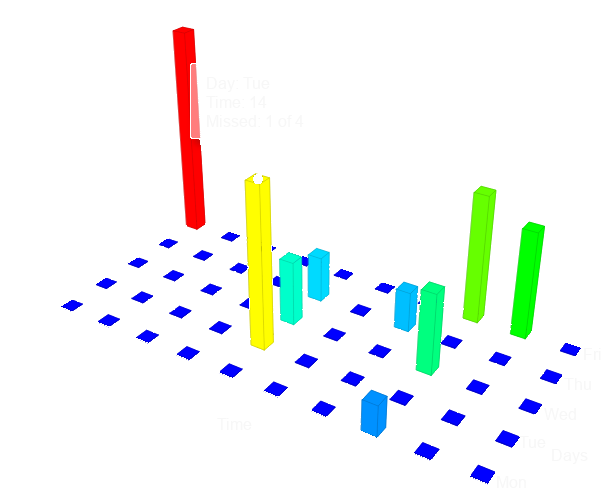
From the graph, it's apparent that the maximum number of missed calls is recorded at the end of the workday on Friday and during lunchtime on Tuesday. During Tuesday's lunch break, four calls were received by four employees, yet one call went unanswered, despite no previous or subsequent misses. In this case, it's possible that the cause was the lunch break.
Let's examine the details of the missed call in the call detail record (CDR) log. In the RingoLine PBX, we have significantly enhanced the standard CDR, adding more detailed call information.

The table displays everything that occurred with the call from the moment it arrived at the PBX. This is one of the distinguishing features of the RingoLine PBX.
- At 14:38:00, the call came in through an external line (from the provider) and was redirected to the "Main Inbound" processing scheme.
- The "Main Inbound" is configured in such a way that an automatic voice greeting is played to the client for 8 seconds initially, followed by a transfer to the "Managers" queue and subsequently to all department managers' phones, with an expected waiting time of around 20 seconds.
- At 14:38:31, the PBX attempted to connect with the managers' phones again, waiting for about 20 seconds.
Retry attempts continued until the client hung up after waiting for about a minute and a half. During this time, all four employee lines were available, as the station doesn't transfer calls to busy lines.
Of course, this analysis won't provide a complete picture, but it will undoubtedly prompt further consideration. In many cases, such information is sufficient to make changes to your telephone system's organization.
Reserve Employee Calculation
If your analysis leads to the conclusion that incoming calls are frequently missed due to employee busyness, it might be worthwhile to consider expanding your workforce.
Hiring new employees is not a simple task. Besides additional expenses for salaries, funds need to be allocated for their recruitment, training, and adaptation. This might not always be feasible, especially for small companies. A more realistic approach could involve utilizing reserves within the company. Since increasing the number of people on call reception is required during specific time intervals with high call volumes, a group of reserve employees could be formed to join the incoming call processing as needed.
To illustrate this idea, let's return to the diagram from our example.

As we noted earlier, the 3rd stage (after the 25-second mark) is characterized by all employees already being engaged (conversing with clients). Thus, the remaining calls need to wait until a manager becomes available to take the call. At this point, queued calls can be redirected to a reserve group.
To estimate the number of calls in question, let's look at the distribution from a different perspective.
Over the reporting period, 210 clients waited for over 30 seconds. This is the number of calls that could be redirected to the reserve group.
Now, let's examine the quantity of missed calls by hour and day of the week on a 3D diagram.
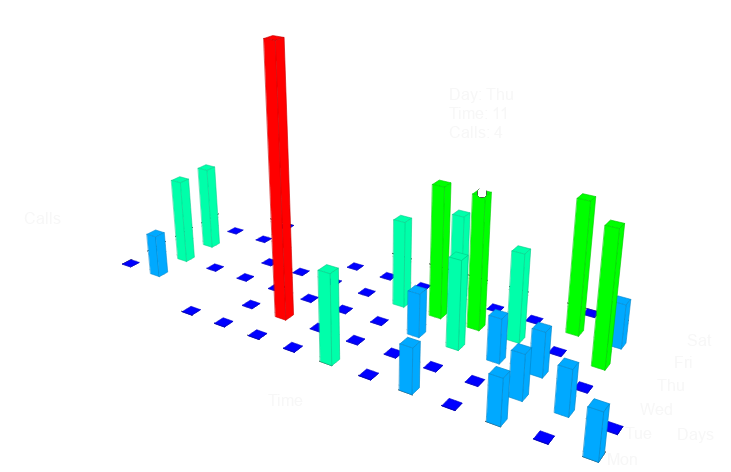
Tuesday will be excluded from consideration. Apparently, there was an objective reason why the managers did not handle the calls. The workload on Tuesdays is usually low. Let's take the following maximum values. We can see that the workload for the backup group will be approximately 4 calls per hour on Thursday and Friday, and lower on other days.
Using the Erlang C formula, we determine that two backup employees will be sufficient to handle such a number of calls without any waiting time.
Thus, by configuring the PBX to redirect incoming calls starting from the 30th second to an extended group consisting of the main and backup staff of 2 people, it is possible to increase the throughput by approximately 200 additional calls per month. The maximum workload for the backup group will be around 4 calls per hour.
Such a simple analytical analysis of statistics can provide guidance on the direction to improve the performance of your telephone system.
Analysis of the Voice Menu
In addition to analyzing statistics, there are other features of the telephone system that can affect its efficiency.
One of these features is the use of a voice menu (IVR - Interactive Voice Response). A voice menu is a common component of a telephone system that allows the subscriber (in our case, the client) to choose the direction for redirecting their call based on voice prompts and subsequent keypad entry to confirm the selection of a particular option offered by the system.
Using this feature can often eliminate the need for a secretary or an operator to connect the subscriber to the required employee or service within the company. However, the voice menu also carries certain risks of call loss, as it reduces the comfort of communication for customers.
The voice menu can both reduce and increase the time for call processing. A voice menu with many options or multiple levels of nesting can irritate the caller. They may simply not have the patience to go through the entire menu to establish a connection. Therefore, the voice menu needs to be carefully planned and creatively designed. The process of developing the "right" voice menu may also be iterative.
In our RingoLine PBX, a special report on the operation of the voice menu has been created, allowing evaluation of which menu items are selected by customers and with what kind of frequency. This report can help assess the effectiveness of the voice menu.
Voice Menu "Main"
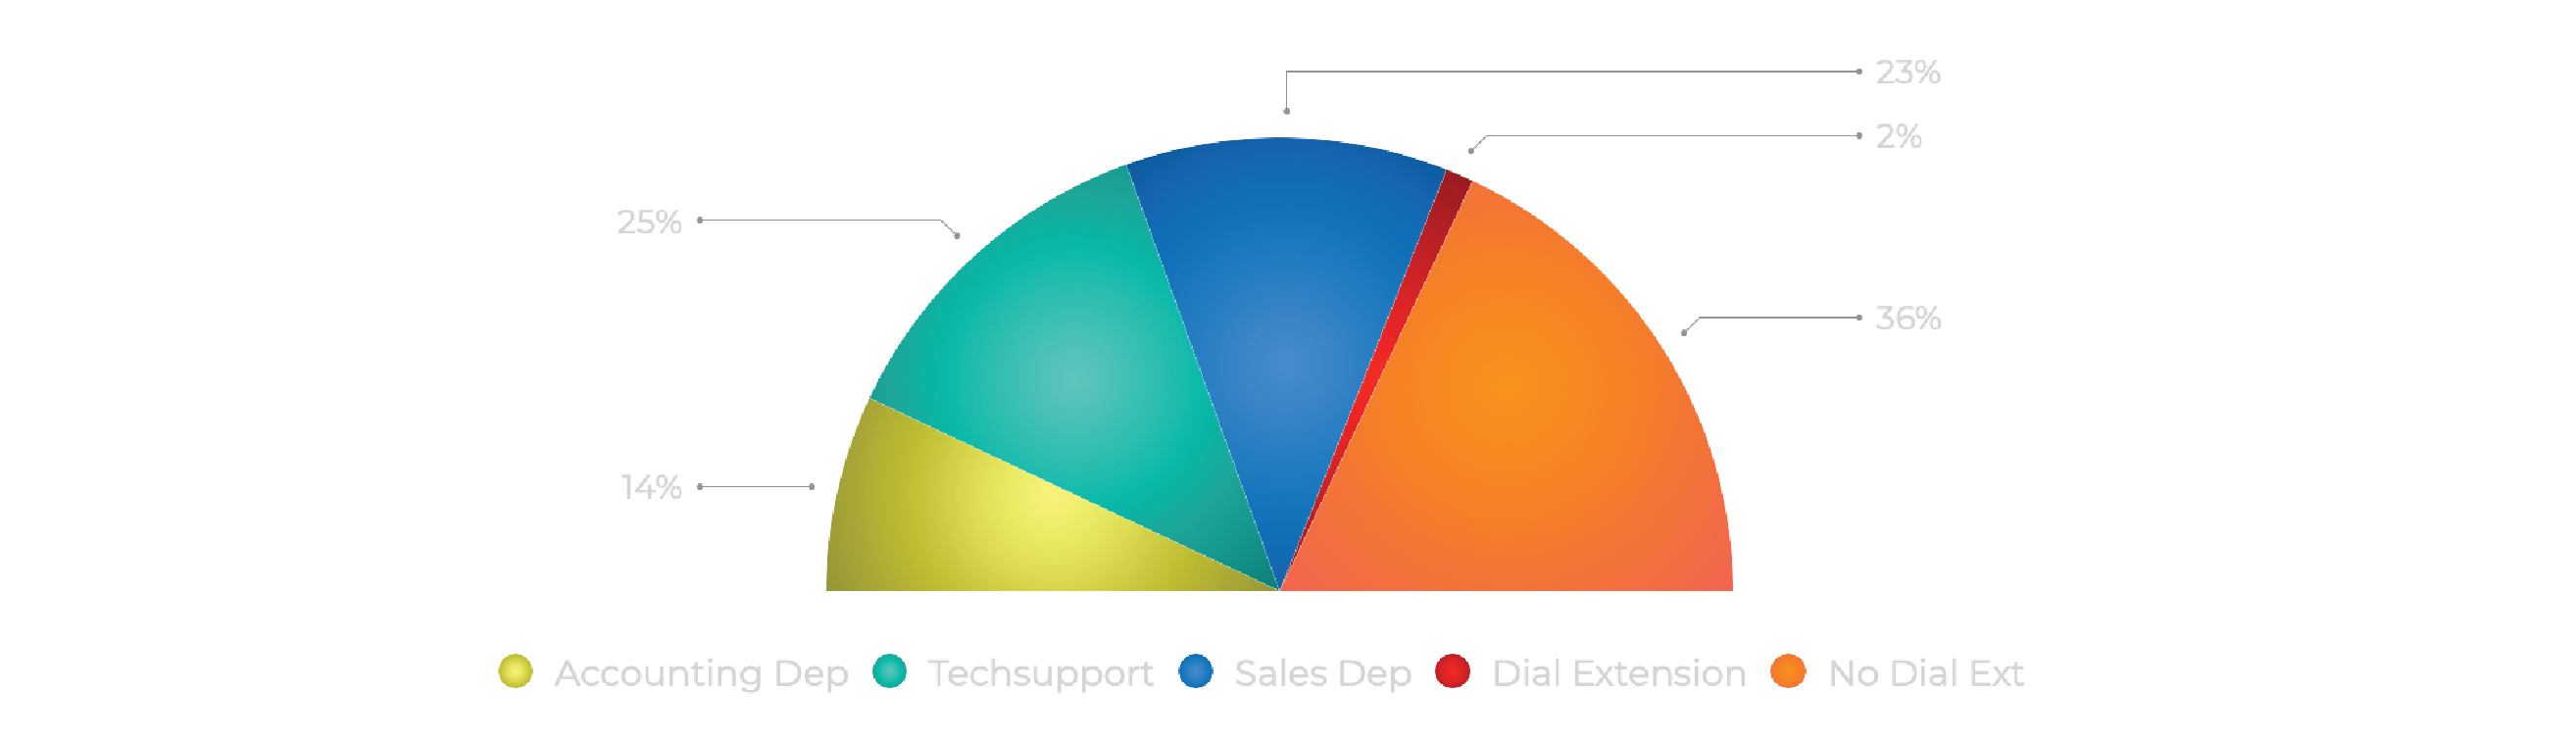
An example diagram of the operation of the voice menu is provided, in which customers choose either departments: accounting, sales, technical support, or dial an internal employee number, or wait and do not make any selection, in which case the PBX redirects them to the sales department after a certain time interval.
With this menu implementation, the workload on the sales department for incoming calls is reduced by 41%. The duration of playing menu items, including waiting time for selection, is 14 seconds. Therefore, for customers who wait for a response and do not make any selection from the menu, the waiting time is 14 seconds longer than if they called directly without the voice menu. Such an increase in waiting time may result in additional loss of incoming calls. The number of such losses can be calculated using the methodology described above in our article.
This analysis will help determine the usefulness of implementing a voice menu. However, to assess this, it will be necessary to try using the voice menu at least in a pilot mode to collect relevant statistics.
Control of Multiple Transfers
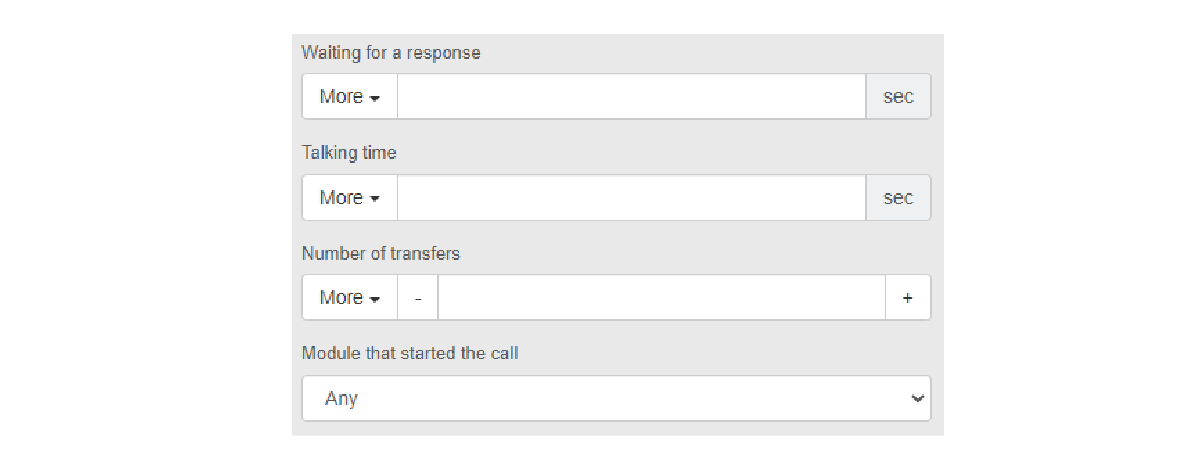
It is difficult to say whether multiple transfers are a real problem, but it is still worth paying attention to this issue when planning your telephone system and monitoring it.
Recorded Calls Listening
Another important tool for call analysis and configuring your telephony system is call recording.
Listening to call recordings can help you with a deeper analysis of how your system functions. Analyzing reports may not always reveal the real cause of a problem. Conversation analysis can show unexpected results. For example, it may turn out that your employee is simply not polite or competent enough. They may not know how to use the telephone device, transfer calls, have a phone directory within reach, or know how to use it. You can discover this by listening to the call recording.
Listening to call recordings can be used for other purposes as well, but that goes beyond the scope of our article.
To summarize, here's what we discussed in our article:
- Gather statistics on your phone system's performance
- Analyze the collected statistics from different perspectives
- Visualize data on missed calls
- Evaluate employee workload and productivity
- Set up notifications to respond to real-time issues
- Try to improve the situation with missed calls by involving a backup group of operators during peak hours
- Consider using a voice menu as a self-service tool
- Pay attention to multiple transfers
- Use call recordings if necessary
- Keep trying to improve system efficiency using an iterative approach